
Candlestick patterns, explained
Every pattern in the PDF, in more depth.
ReadYou searched for a candlestick chart patterns PDF because you want every pattern on one sheet you can keep beside your screen. So here it is: 40 patterns, each with a diagram, what it means and what confirms it, built for NSE charts. Free, printable, no email.
If you searched for a “candlestick chart patterns PDF”, I can guess what you were after: every pattern on one sheet, with a picture of each, that you can keep next to your screen while you learn to read charts. Not a text list of names, and not a blurry scan of someone’s slides. So we made one. Forty patterns, each drawn with the trend that comes before it, what it means and what should happen next before you take it seriously. No email box, no sign-up.
Download the free candlestick patterns PDF
It’s a straight free download, 7 pages, sized for A4, and there’s a candlestick pattern PDF in Hindi too. There’s also a one-page poster of all 40 patterns if you’d rather pin it up or use it as a wallpaper. For the longer explanation of each pattern, the candlestick patterns guide goes through all 40 with the same diagrams.
Every page carries the SEBI disclaimer, because this is education, not a tip sheet.
Here’s the full list, grouped the way the sheet is. Each name links to the full explanation in the guide.
Single candlestick patterns (14): doji, long-legged doji, dragonfly doji, gravestone doji, spinning top, hammer, inverted hammer, hanging man, shooting star, bullish marubozu, bearish marubozu, takuri line, high-wave candle and bullish belt hold.
Two-candle patterns (11): bullish engulfing, bearish engulfing, piercing line, dark cloud cover, bullish harami, bearish harami, tweezer bottom, tweezer top, bullish kicker, bearish kicker and inside bar.
Three-candle reversal patterns (9): morning star, evening star, three white soldiers, three black crows, three inside up, three inside down, three outside up, three outside down and advance block.
Continuation patterns (6): rising three methods, falling three methods, rising window, falling window, upside tasuki gap and mat hold.
If you only want the bullish candlestick patterns, or only the bearish ones, the tags on each card do the sorting for you: green tags are bullish, red tags are bearish. Most reversal patterns also come in mirror pairs, and learning them as pairs halves the work. A hammer at the bottom of a fall and a hanging man at the top of a rise are the same shape; so are a morning star and an evening star, flipped. The mirror-pairs table in the guide lays out all twelve pairs in one place.
The first two questions are really about reading the chart around the pattern, which how to read a stock chart covers step by step. The last one is about volume, and reading volume on stocks explains what “above average” looks like in practice.
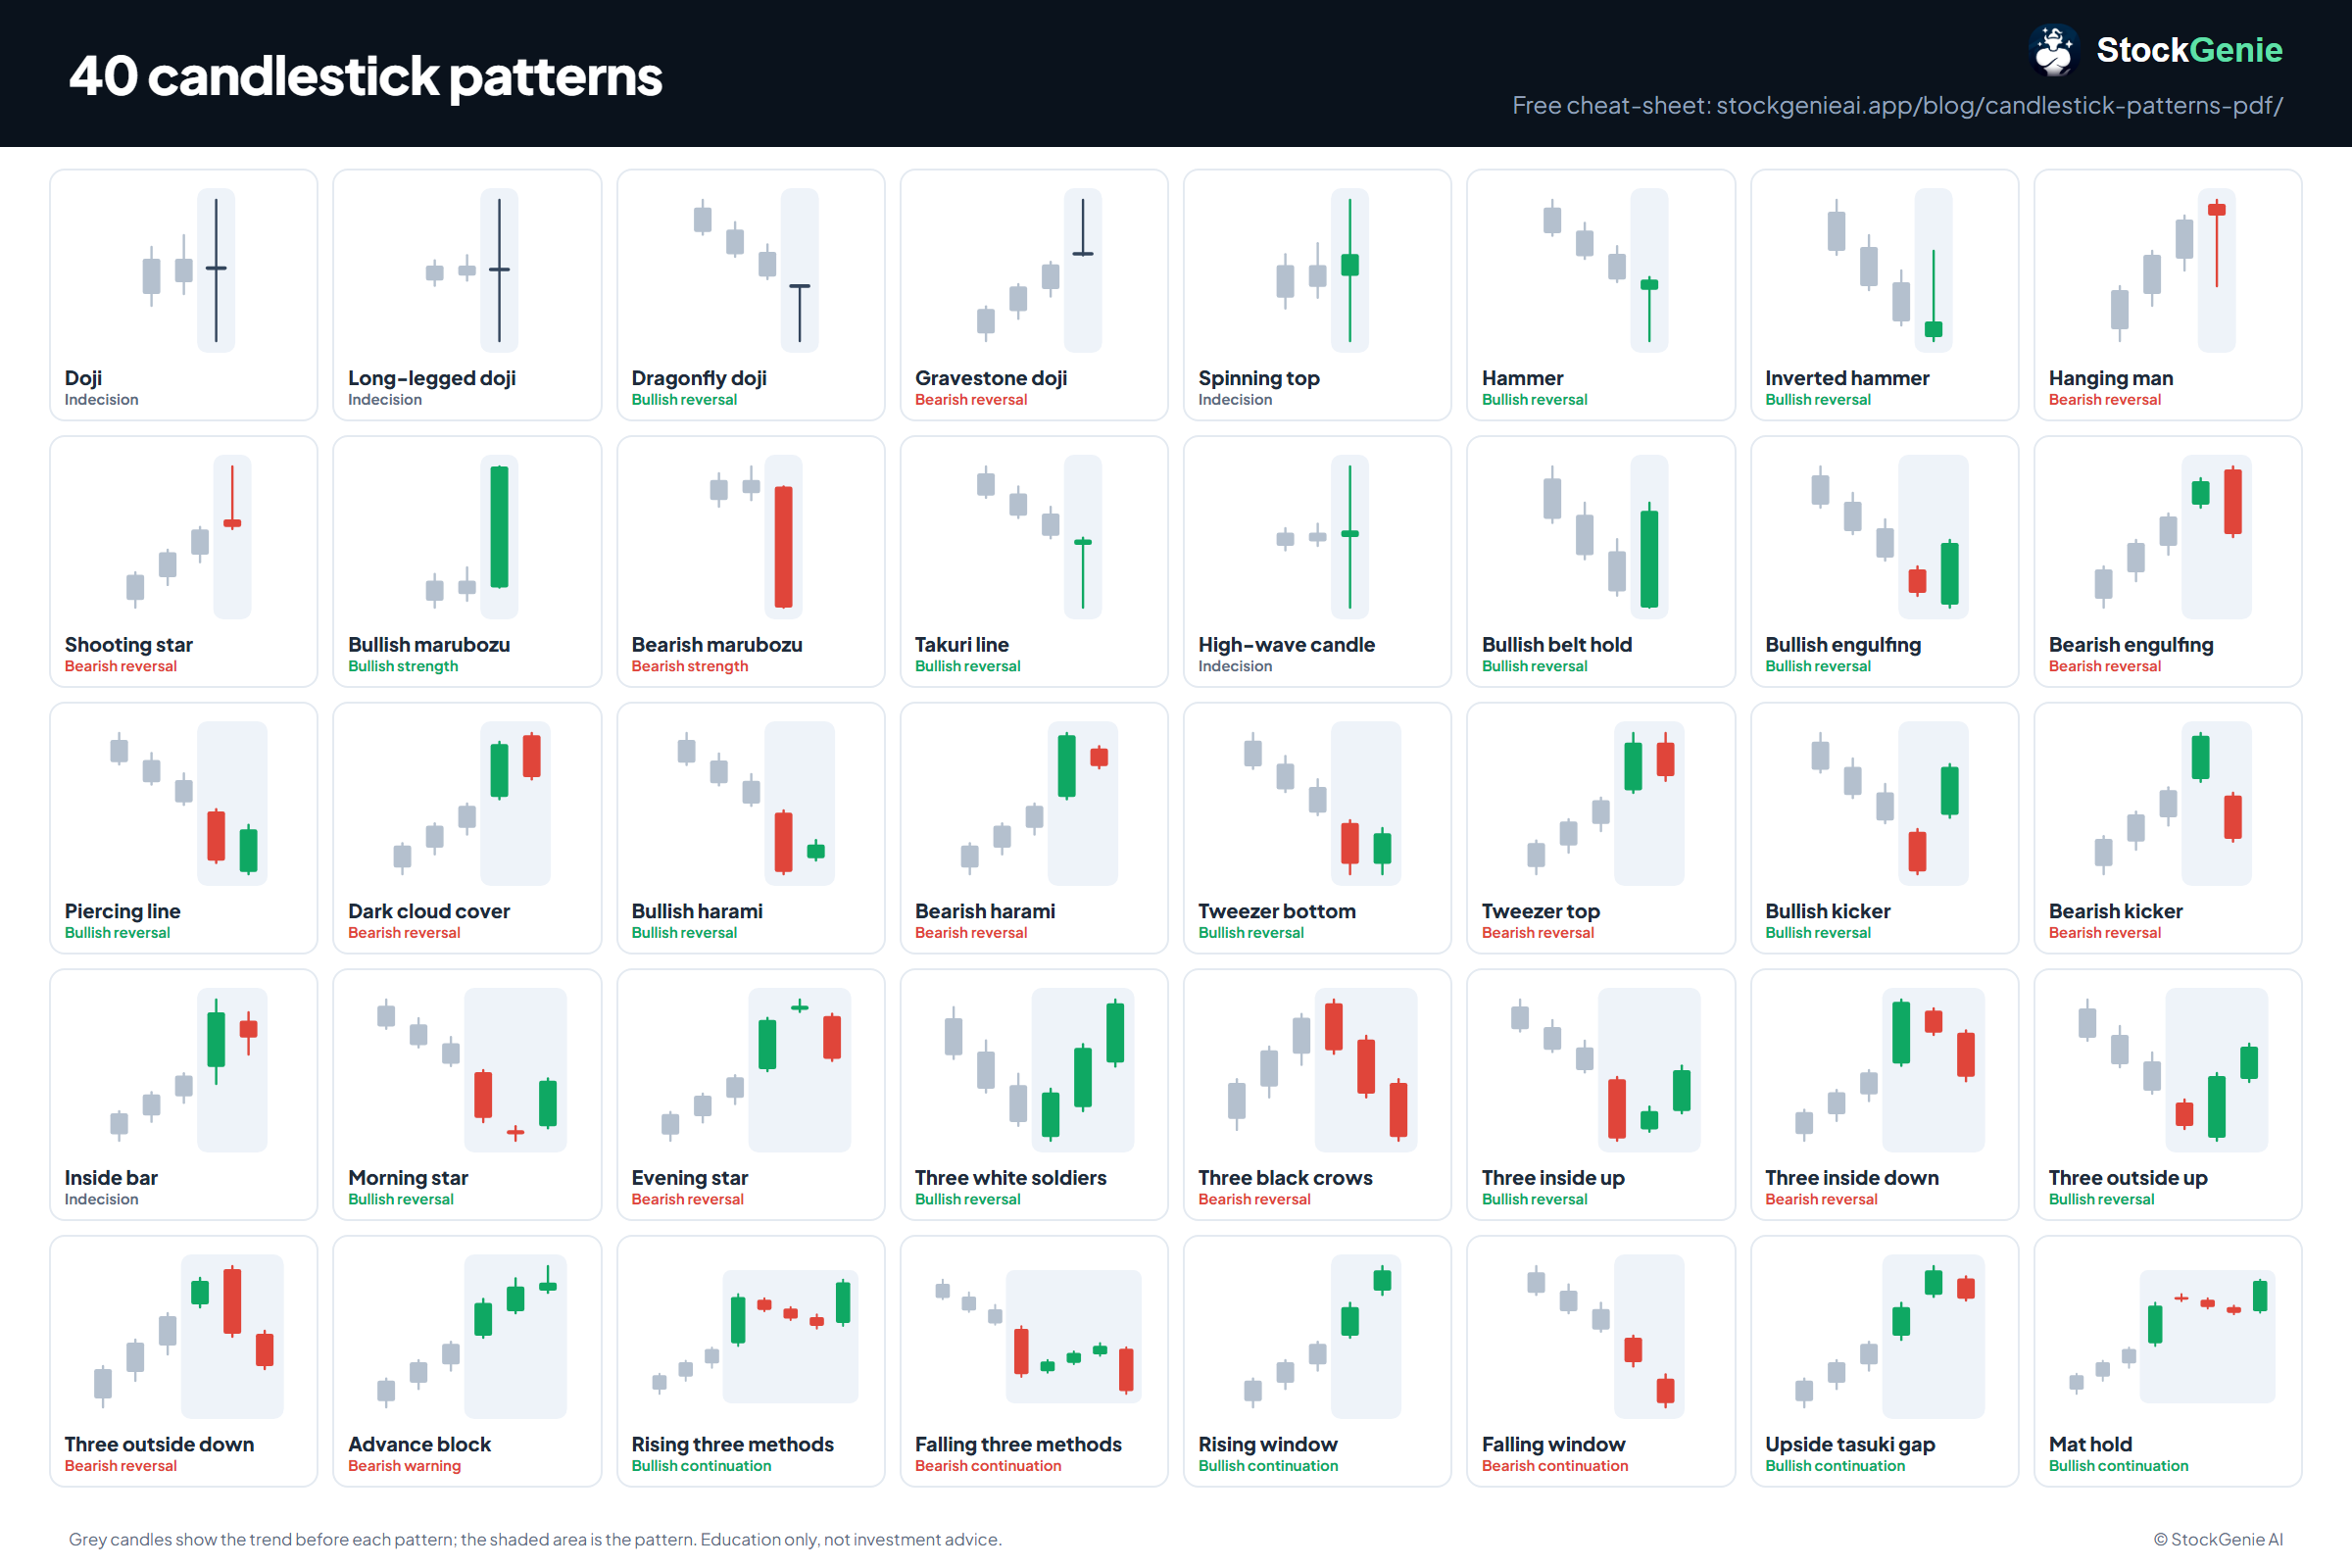
All 40 patterns on one image, 2400 by 1600 pixels. It works as a laptop wallpaper, and it prints cleanly on A3 if you want it on the wall beside your desk. Download the candlestick patterns poster (right-click and save, or long-press on a phone).
A lot of people search for those exact titles. They refer to e-books that circulate online in several versions, and we can’t vouch for the copies you’ll find. Ours is a different sheet with 40 patterns, which covers all of the common ones. Past about 40, the extra patterns are rare variations you’ll struggle to find on a real NSE chart, and learning them mostly adds names, not skill.
The PDF is a reference; a book teaches the thinking behind it. Three are worth knowing about, and our list of the best stock analysis books for India covers the wider shelf:
If you’re searching for a candlestick pattern book PDF for free, the free copies of these are pirated scans, and they’re illegal and often malware-laced. Buy the e-book or use a library. For free and legal reading, Zerodha Varsity’s technical analysis module covers candlesticks for Indian markets. For the wider chart picture, the free chart patterns PDF draws 20 chart patterns the same way, and the technical analysis PDF puts the indicators on two pages.
Candlesticks are one part of what technical analysis is, and technicals are one half of stock market analysis. A sheet still leaves you checking every chart by eye. StockGenie’s technical analysis app reads the chart on any NSE stock, trend, levels, RSI, MACD and volume, in plain English or Hindi, and on Premium its AI also flags recognisable chart patterns and tells you whether they sit at a level that matters. Like the PDF, it gives no buy or sell calls. It shows you the read and leaves the decision with you.
StockGenie provides analysis and education only, not investment advice. Always consult a SEBI-registered adviser before investing.